HasOffers Process Study
HasOffers is a performance marketing platform that allows publishers (like blog and news sites) to display ads (offers) and be paid for driving high-quality customer engagement with the product the advertiser is offering.
Problem
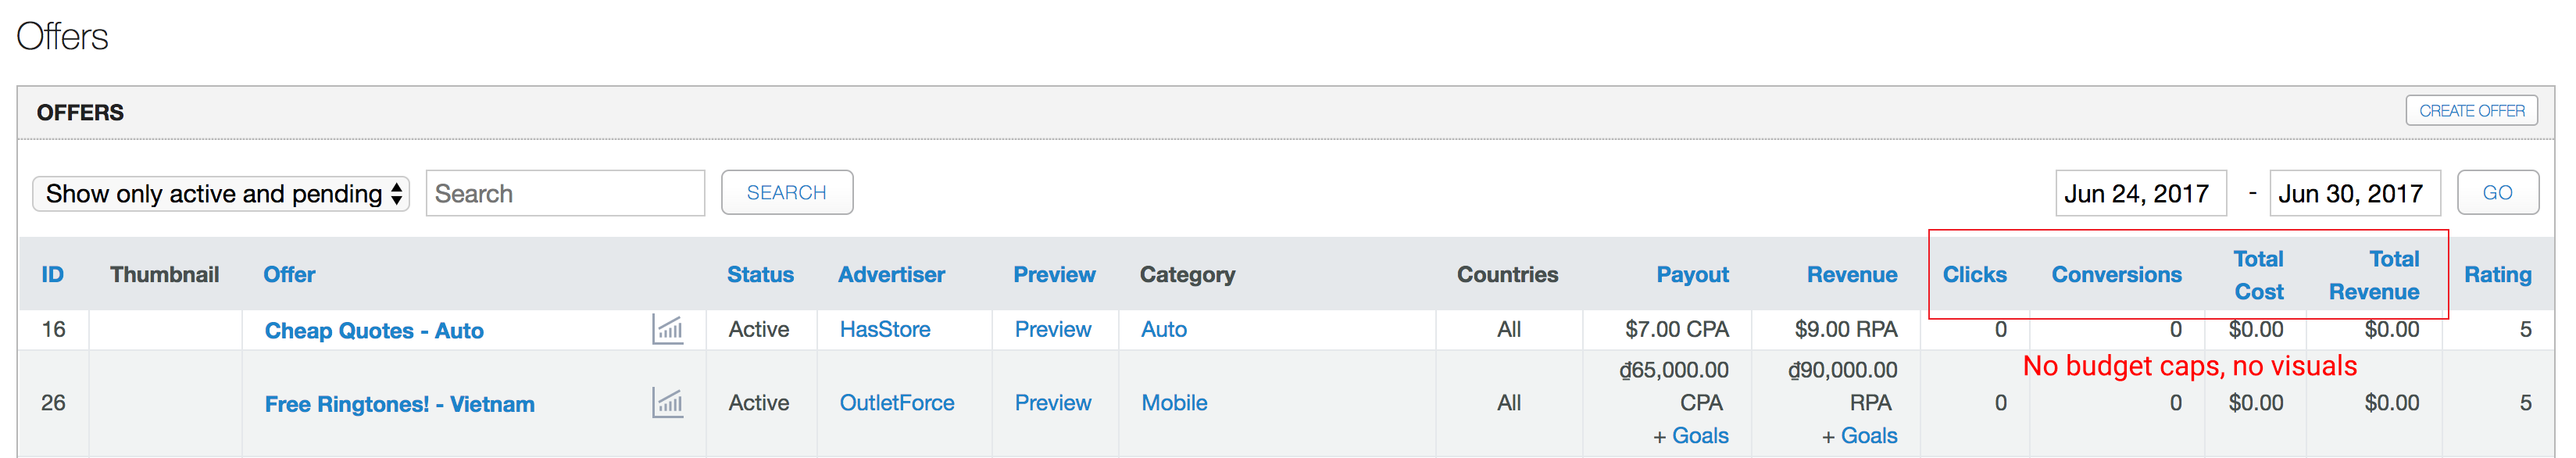
- No easy way to visualize offer performance for a current offer a user is closely tracking
- No way to view budget cap progress for an offer at all
Discovery
These issues were discovered through user observation during a field study with multiple clients.
Other ways I would typically discover problems:
- conversations with marketing, sales, and support
- evaluating industry trends
- analysis of the product and usage patterns
Collecting Information
- Discussion with product, account management, and engineering
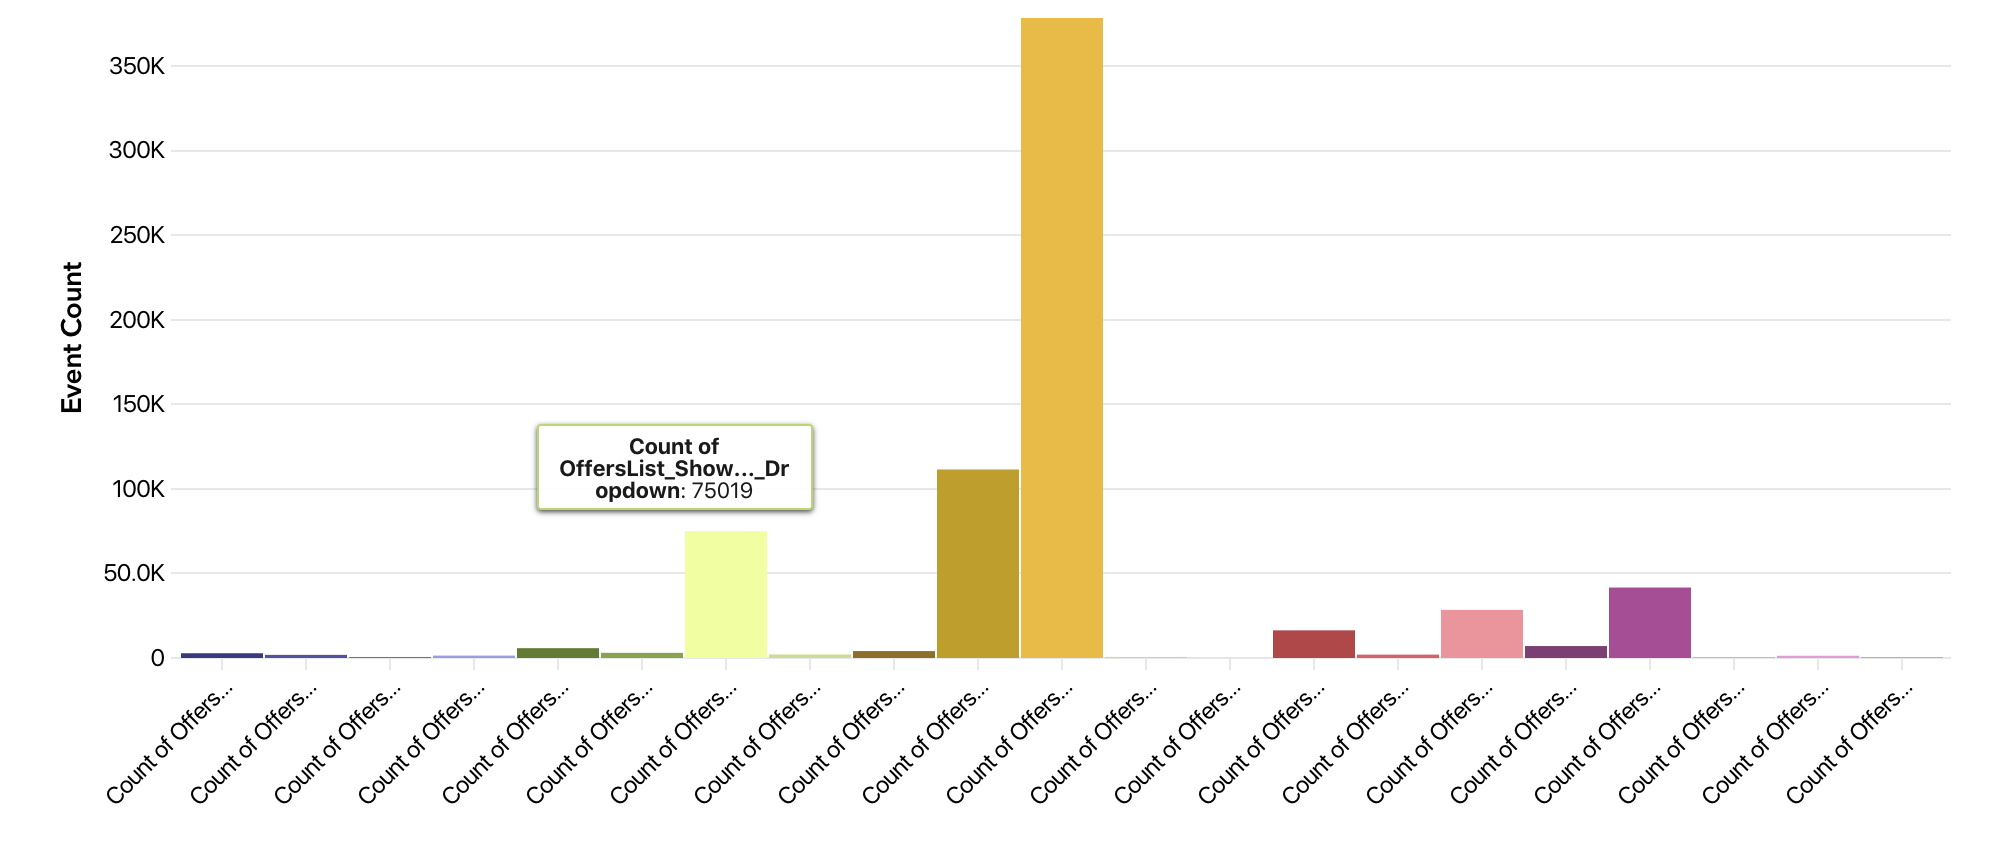
- Product usage analytics
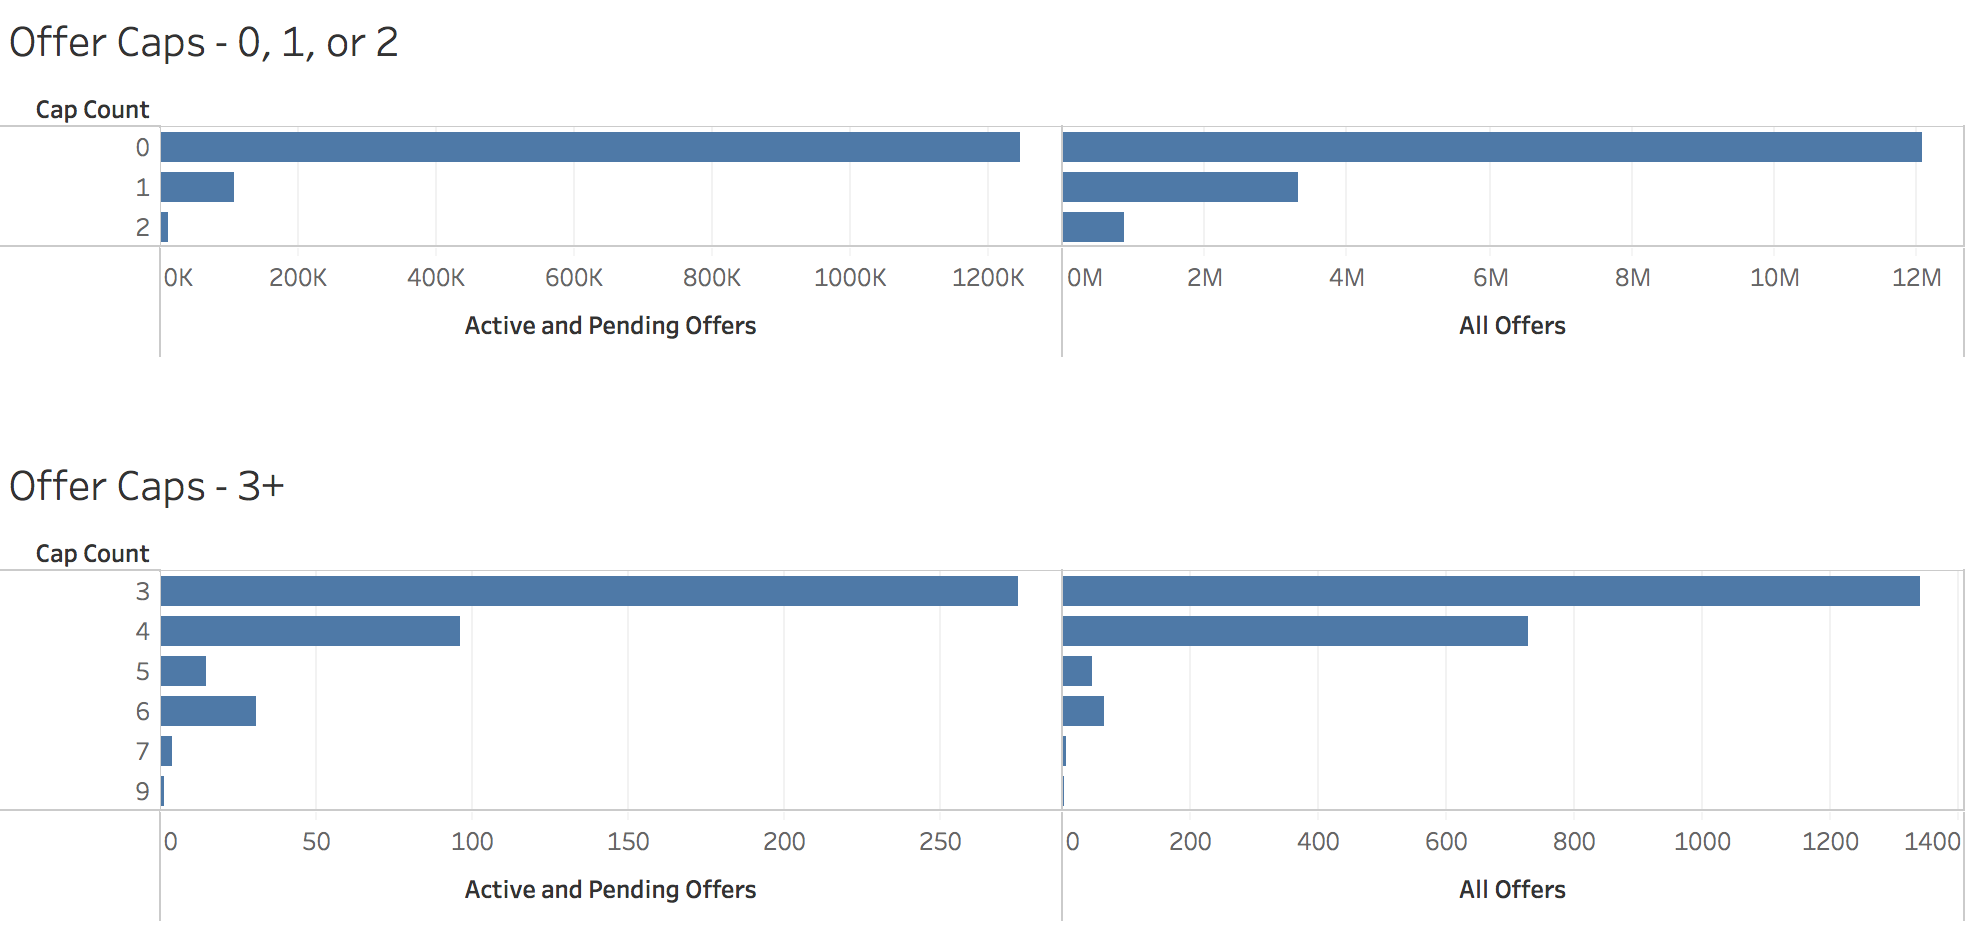
- Database usage queries, analysis, and visualizations shared with team
Create
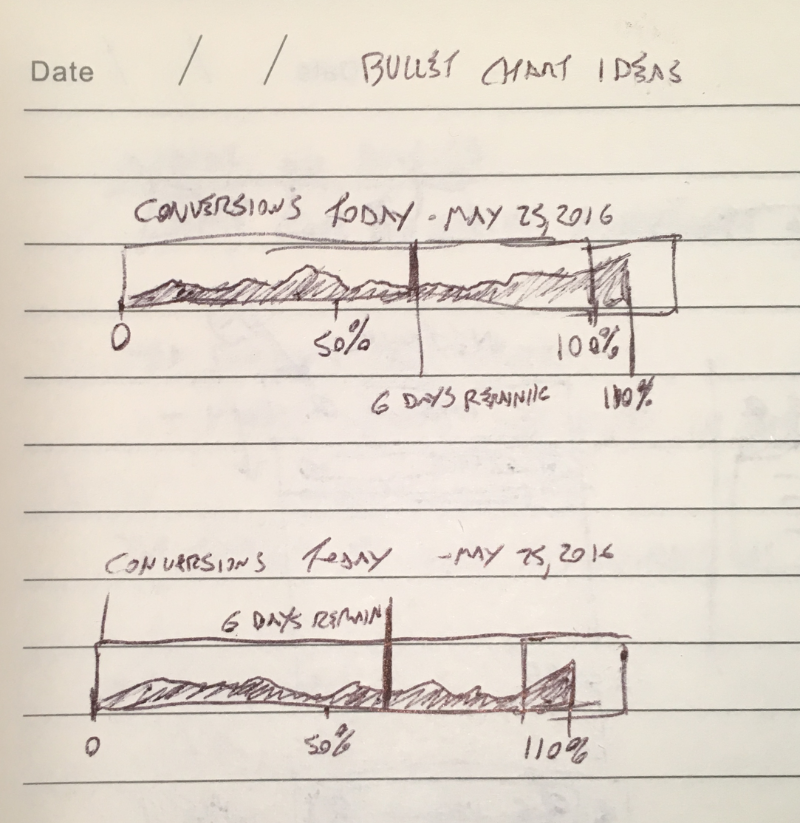
- Whiteboarding/sketching
- Iterating on ideas and technical feasibility
- Interactive prototyping, complete with a story and sample data in UXPin
- Recently I've been leaning more toward Sketch and InVision or Justinmind in advanced cases
- Exploration - alternate bullet chart display
- Comps
Testing and Validation
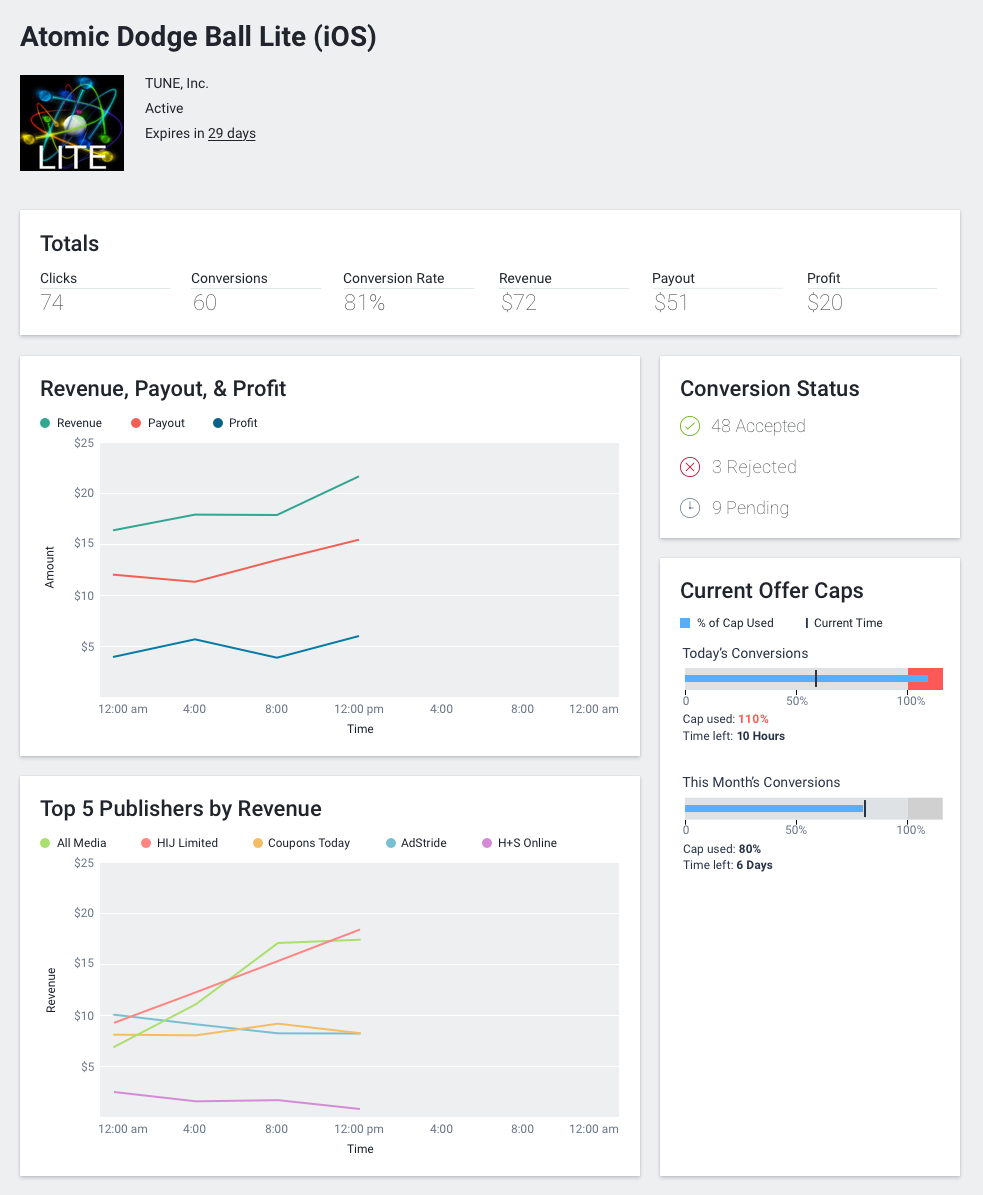
User testing - This test was pretty straightforward and matched user's expectations and assumptions well. We did identify one issue in that the caps section is always only for the current day, but the remainder of the report allows the user to select a timeframe. We made one minor adjustment to the design to change the word "Daily" to "Today" midway through testing and found positive result from subsequent testers.
There was also one tester who provided feedback about the detail and readability of the bullet charts. I explored other presentation options to include a sparkline type presentation of the daily traffic patterns.
- Test on staging and in production for multiple clients with different usage scenarios
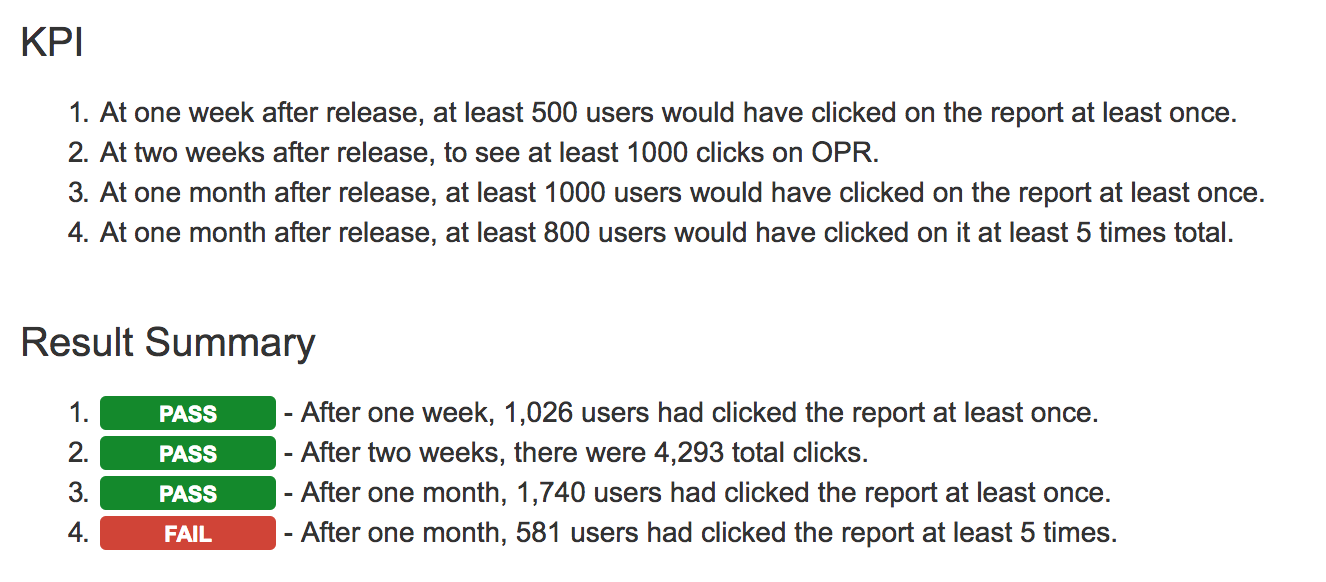
- Monitor release usage and goals